This function creates visualizations of color classification results from a charisma analysis. It can display the original image, recolored image, masked image, color proportions, and pavo color pattern geometry results.
Usage
# S3 method for class 'charisma'
plot(
  x,
  plot.all = TRUE,
  plot.original = FALSE,
  plot.recolored = FALSE,
  plot.masked = FALSE,
  plot.props = FALSE,
  plot.pavo.img = FALSE,
  plot.pavo.classes = FALSE,
  font.size = 1.75,
  props.x.cex = 1.5,
  real.bar.colors = TRUE,
  ...
)
Arguments
- x
- plot.all
Logical. If
TRUE, plots all available visualizations. Default isTRUE.- plot.original
Logical. If
TRUE, plots the original image. Default isFALSE.- plot.recolored
Logical. If
TRUE, plots the recolored image showing discrete color classifications. Default isFALSE.- plot.masked
Logical. If
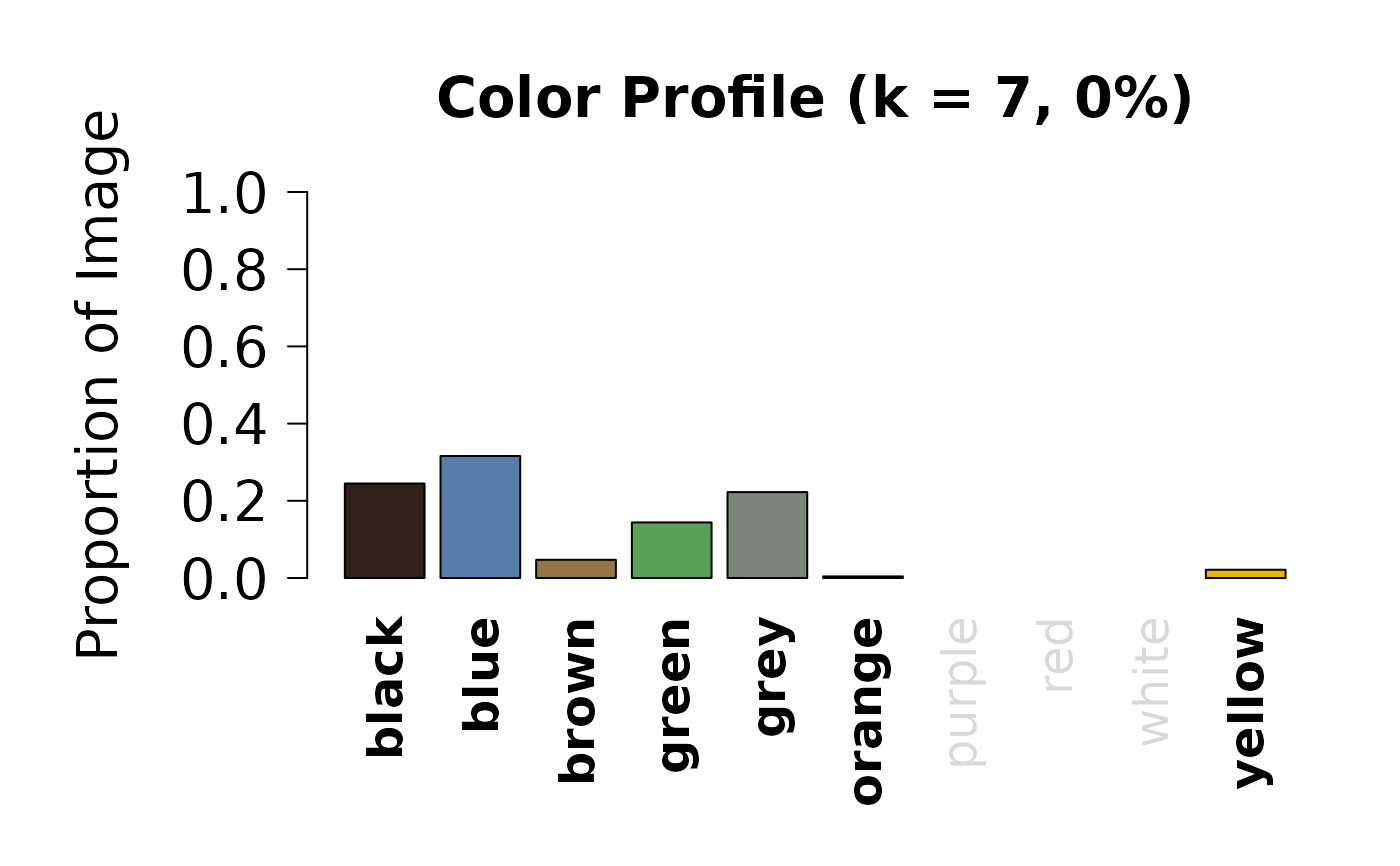
TRUE, plots the masked image after background removal. Default isFALSE.- plot.props
Logical. If
TRUE, plots a bar chart showing the proportion of pixels in each color category. Default isFALSE.- plot.pavo.img
Logical. If
TRUE, plots the image used for pavo color pattern geometry analysis. Default isFALSE. Only available if pavo analysis was performed.- plot.pavo.classes
Logical. If
TRUE, plots the color palette from pavo k-means clustering. Default isFALSE. Only available if pavo analysis was performed.- font.size
Numeric. Size multiplier for plot text elements. Default is
1.75.- props.x.cex
Numeric. Size multiplier for x-axis labels in the proportions plot. Default is
1.5.- real.bar.colors
Logical. If
TRUE, uses actual color values for bars in the proportions plot. IfFALSE, uses a default color scheme. Default isTRUE.- ...
Additional arguments (currently not used).
Details
When plot.all = TRUE, all available plots are displayed in a
multi-panel layout. Individual plots can be selected by setting the
corresponding plot.* parameters to TRUE.
The function automatically detects whether pavo analysis results are present in the charisma object and adjusts the plot layout accordingly.
Examples
# \donttest{
# Run charisma on an image
img <- system.file("extdata", "Tangara_fastuosa_LACM60421.png",
package = "charisma")
result <- charisma(img)
#> Warning: if any are empty, remove them
#> Discrete color classes identified: k=7
#> (black, blue, brown, green, grey, orange, yellow)
#> Image classification in progress...
#> Using single set of coldists for all images.
#>
#> Warning: Image lighting and quality may vary. Before using results in downstream analyses, check color class outputs, and adjust the CLUT as necessary to capture the appropriate color classes in your image dataset.
# Plot all results
plot(result)
 #> Error in par(oldpar): invalid value specified for graphical parameter "pin"
# Plot only original and recolored images
plot(result, plot.all = FALSE, plot.original = TRUE, plot.recolored = TRUE)
#> Error in par(oldpar): invalid value specified for graphical parameter "pin"
# Plot only original and recolored images
plot(result, plot.all = FALSE, plot.original = TRUE, plot.recolored = TRUE)
 # Plot color proportions
plot(result, plot.all = FALSE, plot.props = TRUE)
# Plot color proportions
plot(result, plot.all = FALSE, plot.props = TRUE)
 # }
# }