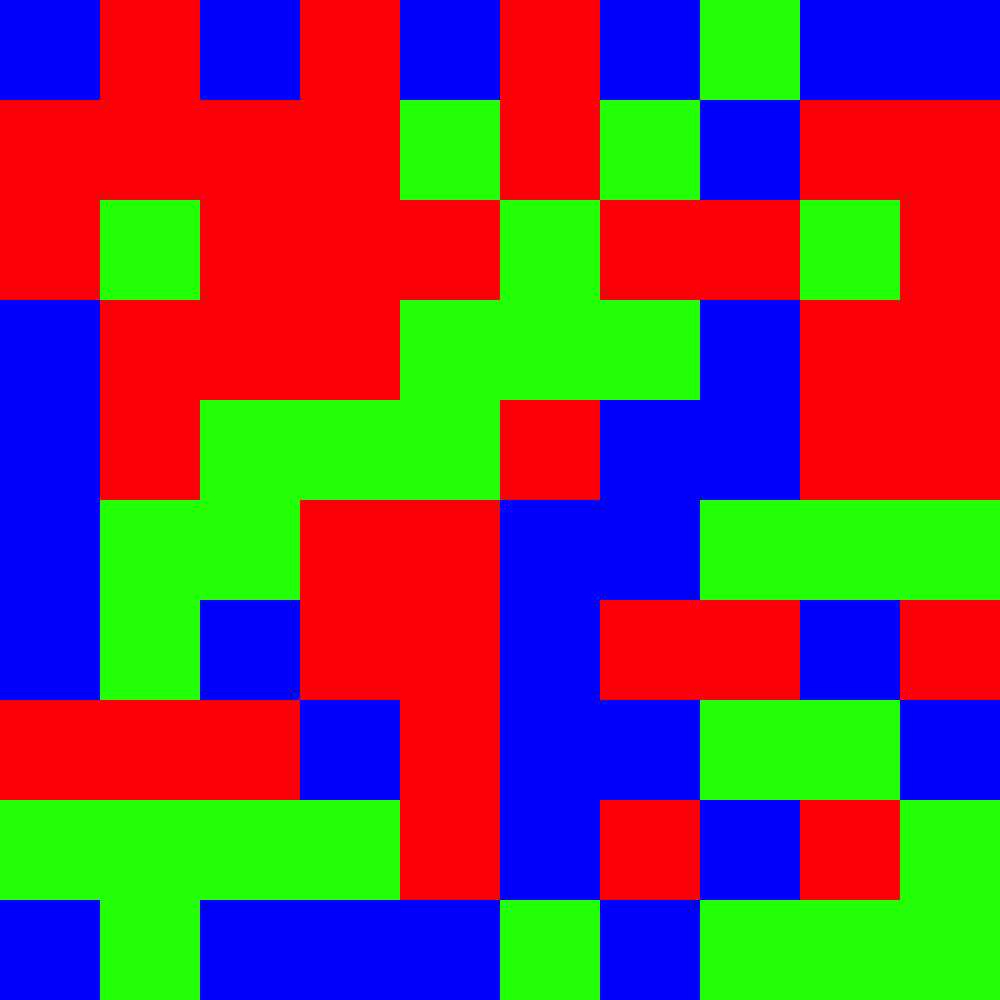
This function generates a randomized mosaic grid visualization representing the proportions of different colors, useful for visually displaying color composition in a standardized format.
Usage
mosaic(
  color.props,
  size = 10,
  out.path = normalizePath("~"),
  out.prefix = "charisma_mosaic",
  verbose = TRUE
)
Arguments
- color.props
List of color proportion objects, where each element contains:
hex: Hex color code (e.g., "#FF0000")color: Color nameprop: Proportion value (all proportions must sum to 1)
- size
Integer specifying the dimensions of the mosaic grid (size x size). Default is 10 (resulting in a 10 x 10 = 100 cell mosaic).
- out.path
Character string specifying the directory path for saving the output PNG file. Default is the user's home directory.
- out.prefix
Character string prefix for the output filename. Default is
"charisma_mosaic".- verbose
Logical. If
TRUE, prints the full output path. Default isTRUE.
Details
The mosaic function creates a visual representation of color proportions by:
Allocating grid cells proportional to each color's proportion
Randomly shuffling cell positions to create a mosaic pattern
Saving the result as a PNG file with an informative filename
The output filename automatically encodes the hex codes, color names, and proportions for documentation purposes.
See also
charisma for generating color classifications
Examples
# Create a mosaic from color proportions
colors <- list(
  list(hex = "#FF0000", color = "red", prop = 0.4),
  list(hex = "#00FF00", color = "green", prop = 0.3),
  list(hex = "#0000FF", color = "blue", prop = 0.3)
)
mosaic(colors, size = 10, out.path = tempdir())
#> /tmp/RtmpTUT5lK/charisma_mosaic_hex-FF0000_color-red_prop-0.4_hex-00FF00_color-green_prop-0.3_hex-0000FF_color-blue_prop-0.3.png
#> [1] "/tmp/RtmpTUT5lK/charisma_mosaic_hex-FF0000_color-red_prop-0.4_hex-00FF00_color-green_prop-0.3_hex-0000FF_color-blue_prop-0.3.png"