charisma provides a standardized, reproducible framework for characterizing discrete color classes in digital images of biological organisms.
Overview
charisma automatically classifies colors in images into 10 human-visible categories using a biologically-inspired Color Look-Up Table (CLUT):
Black · Blue · Brown · Green · Grey · Orange · Purple · Red · White · Yellow
Key Features
✨ Fully Reproducible: Complete provenance tracking of all operations
🎨 10 Color Classes: Biologically-relevant discrete color categories
🔧 Flexible Workflows: From fully automated to completely manual
📊 Evolutionary Integration: Seamless compatibility with geiger, phytools, pavo
⚡ High-Throughput: Designed for analyzing large image datasets
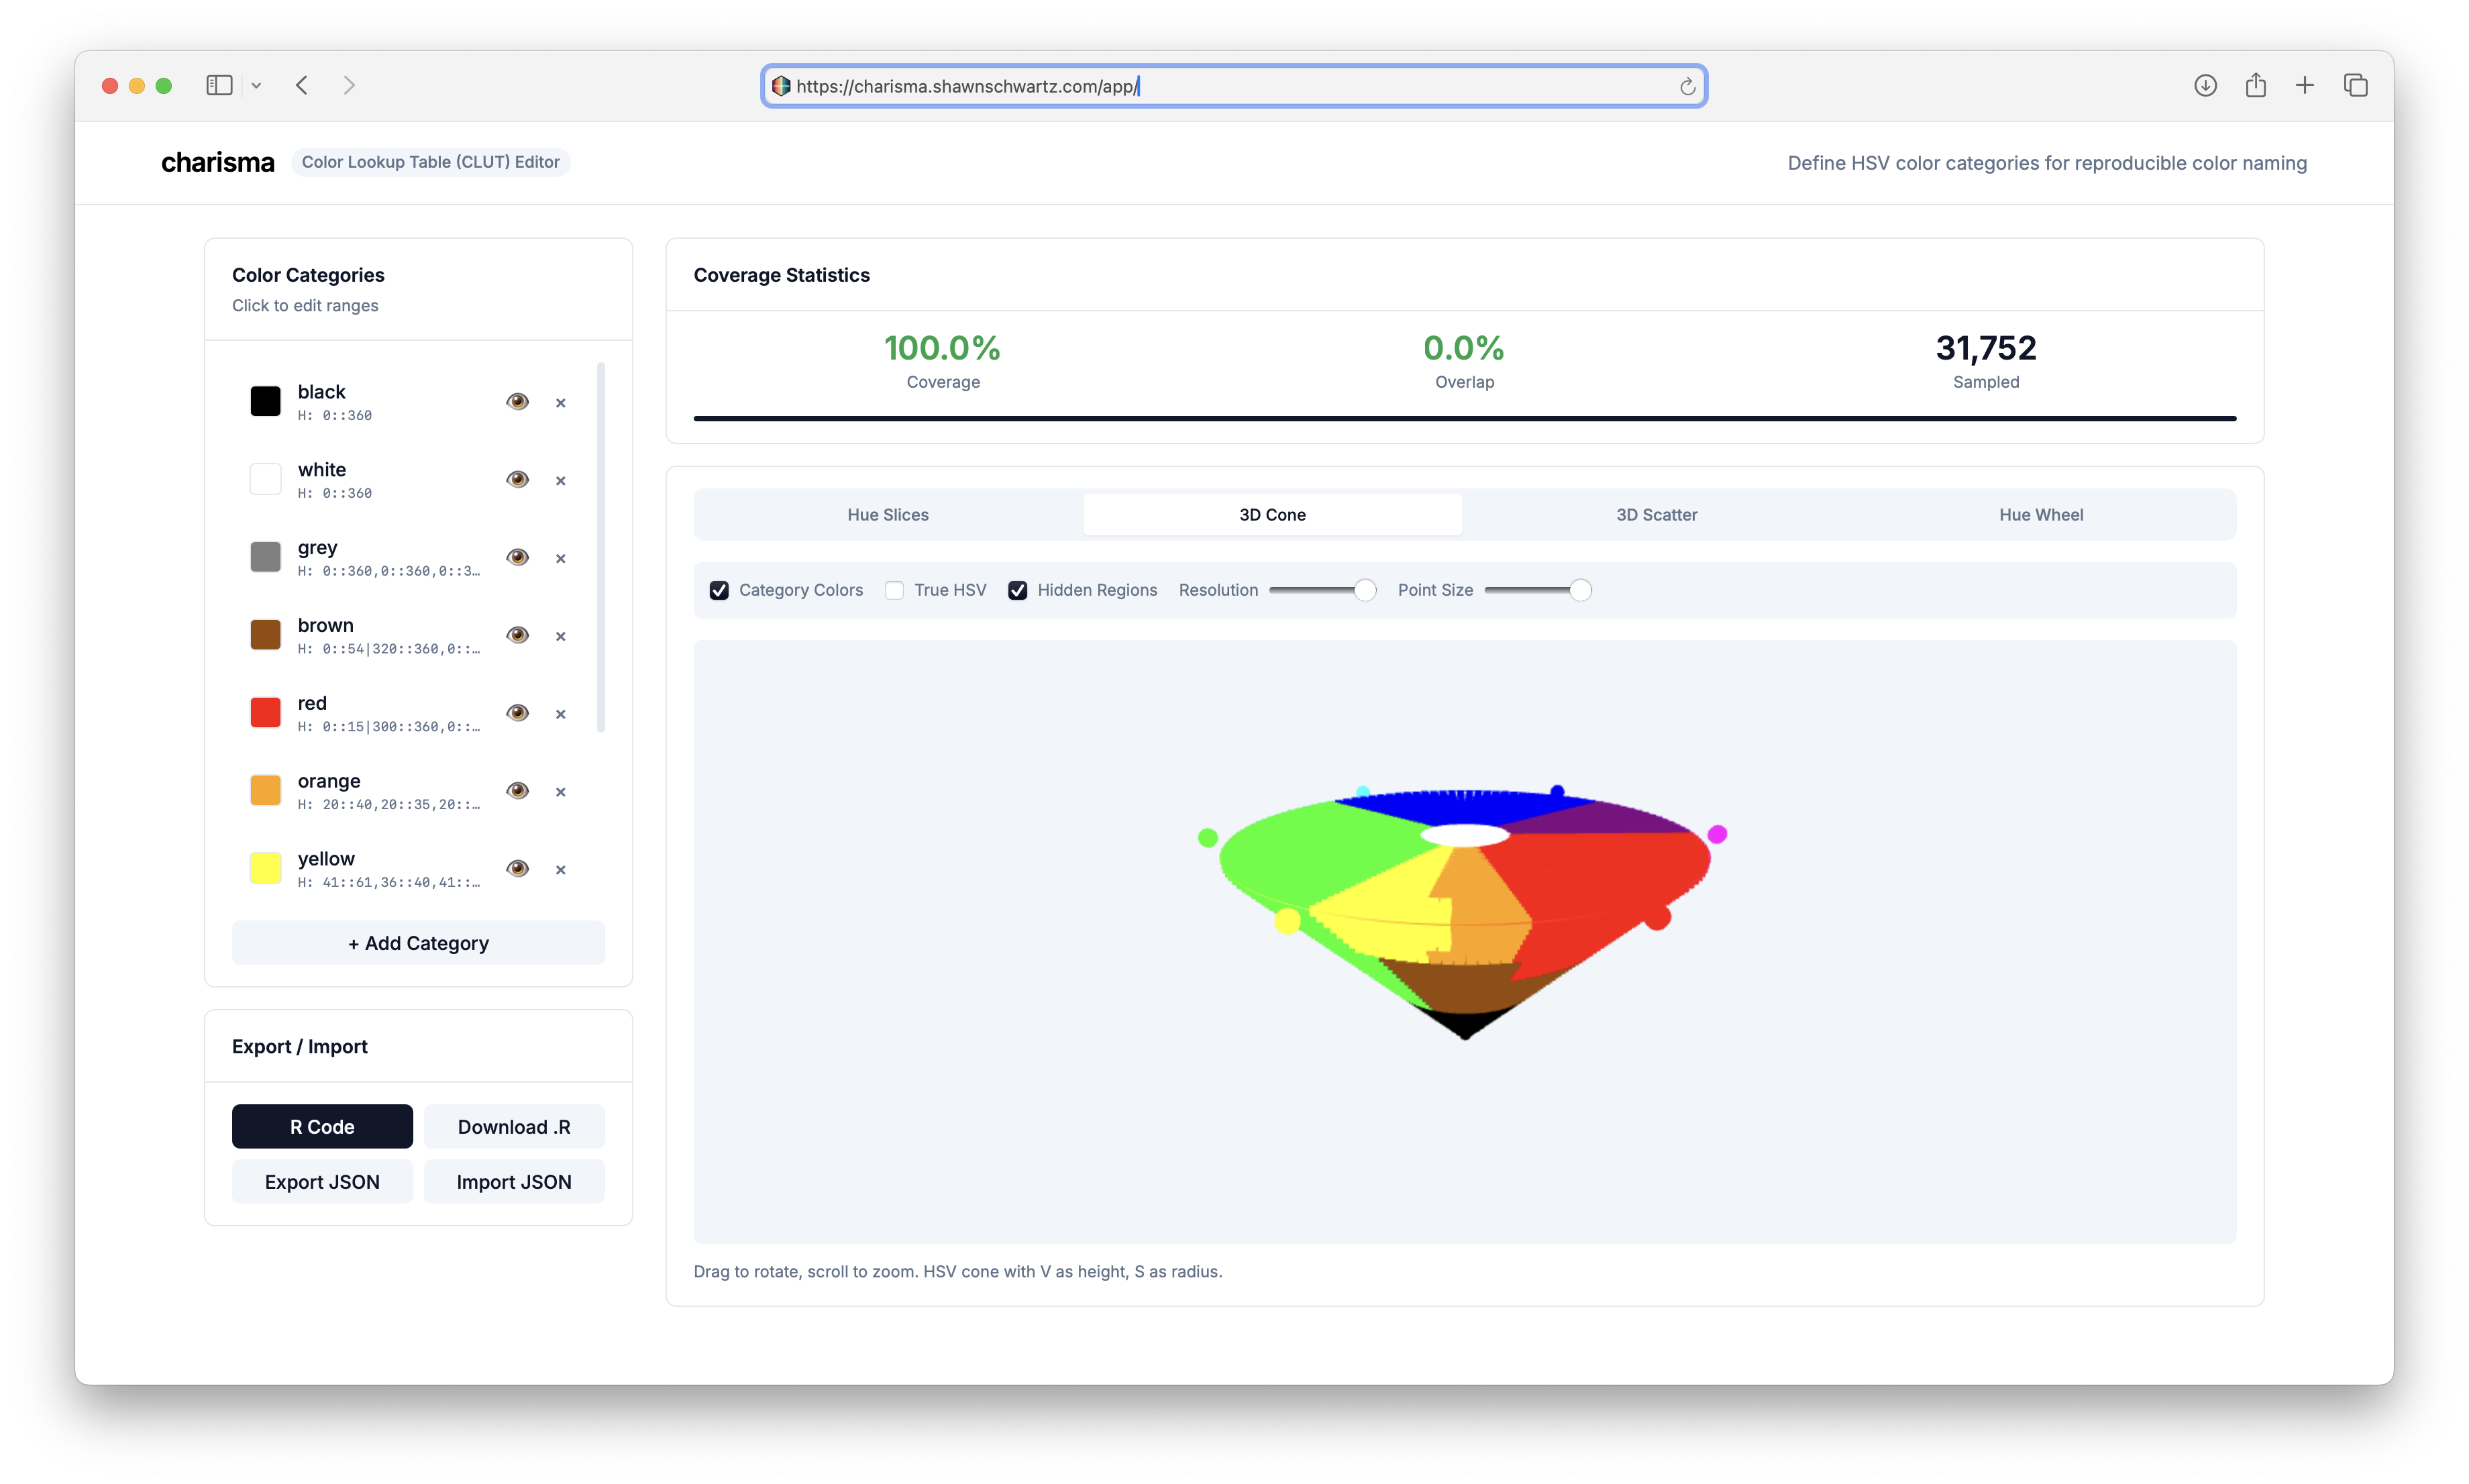
🔍 Validated CLUT: Non-overlapping HSV color space partitions
Installation
System Dependencies
charisma depends on spatial R packages that require system-level libraries. Install these first:
macOS (via Homebrew):
Ubuntu/Debian:
Fedora/RedHat:
Stable Version (CRAN)
install.packages("charisma")Quick Start
library(charisma)

# Load example image
img <- system.file(
  "extdata",
  "Tangara_fastuosa_LACM60421.png",
  package = "charisma"
)

# Basic analysis
result <- charisma(img, threshold = 0.05)

# Visualize
plot(result)

# Interactive mode with manual curation
result_interactive <- charisma(
  img,
  interactive = TRUE,
  threshold = 0.0
)

# Save outputs
result_saved <- charisma(
  img,
  threshold = 0.05,
  logdir = file.path(tempdir(), "charisma_outputs")
)
How It Works
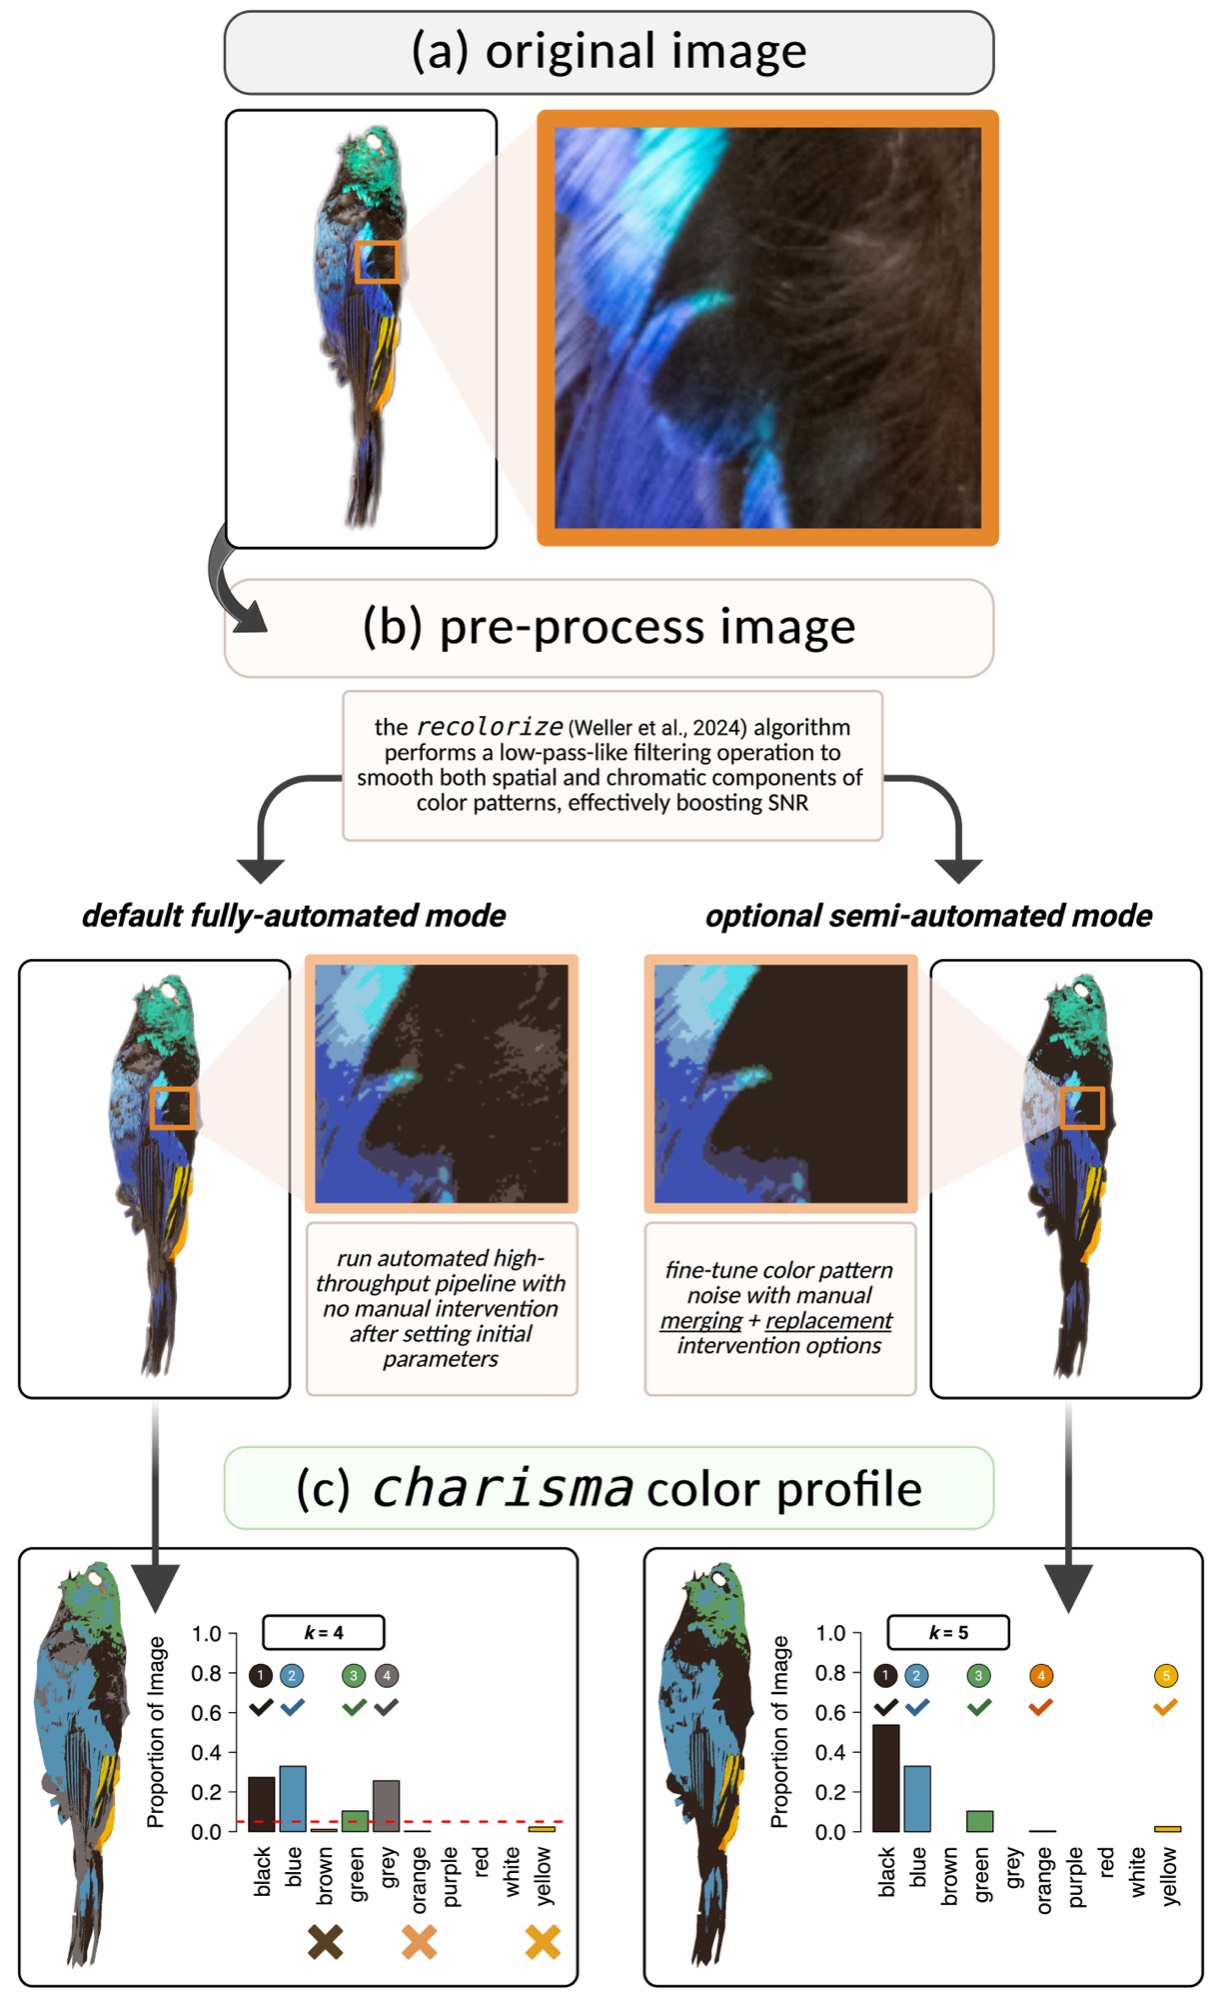
The charisma pipeline consists of three stages:
1. Image Preprocessing
Uses recolorize to perform spatial-color binning, removing noisy pixels and creating a smoothed representation of dominant colors.
2. Color Classification
Converts RGB cluster centers to HSV and matches against the CLUT using color2label():
color2label(c(255, 0, 0))    # "red"
color2label(c(0, 0, 255))    # "blue"
color2label(c(255, 255, 0))  # "yellow"
3. Optional Manual Curation
In interactive mode:
-
Merge color clusters (e.g.,
c(2,3)) - Replace pixels between clusters
- Full operation history maintained for reproducibility
The charisma object contains:
- Color classifications: Discrete labels for each cluster
- Proportions: Pixel counts and proportions per color
- Operation history: Complete log of merges and replacements
- Pavo statistics: Color pattern geometry metrics (optional)
Advanced Features
Re-analyze Saved Objects
# Load previous analysis
obj <- system.file("extdata", "Tangara_fastuosa.RDS", package = "charisma")
obj <- readRDS(obj)

# Apply different threshold
result2 <- charisma2(
  obj,
  new.threshold = 0.10
)

# Revert to specific state
result3 <- charisma2(
  obj,
  which.state = "merge",
  state.index = 2
)
Custom Color Look-Up Tables
Create and customize CLUTs using the interactive CLUT Editor:
# Launch the CLUT Editor in your browser
launch_clut_editor()

# Or use the local version bundled with the package
launch_clut_editor(online = FALSE)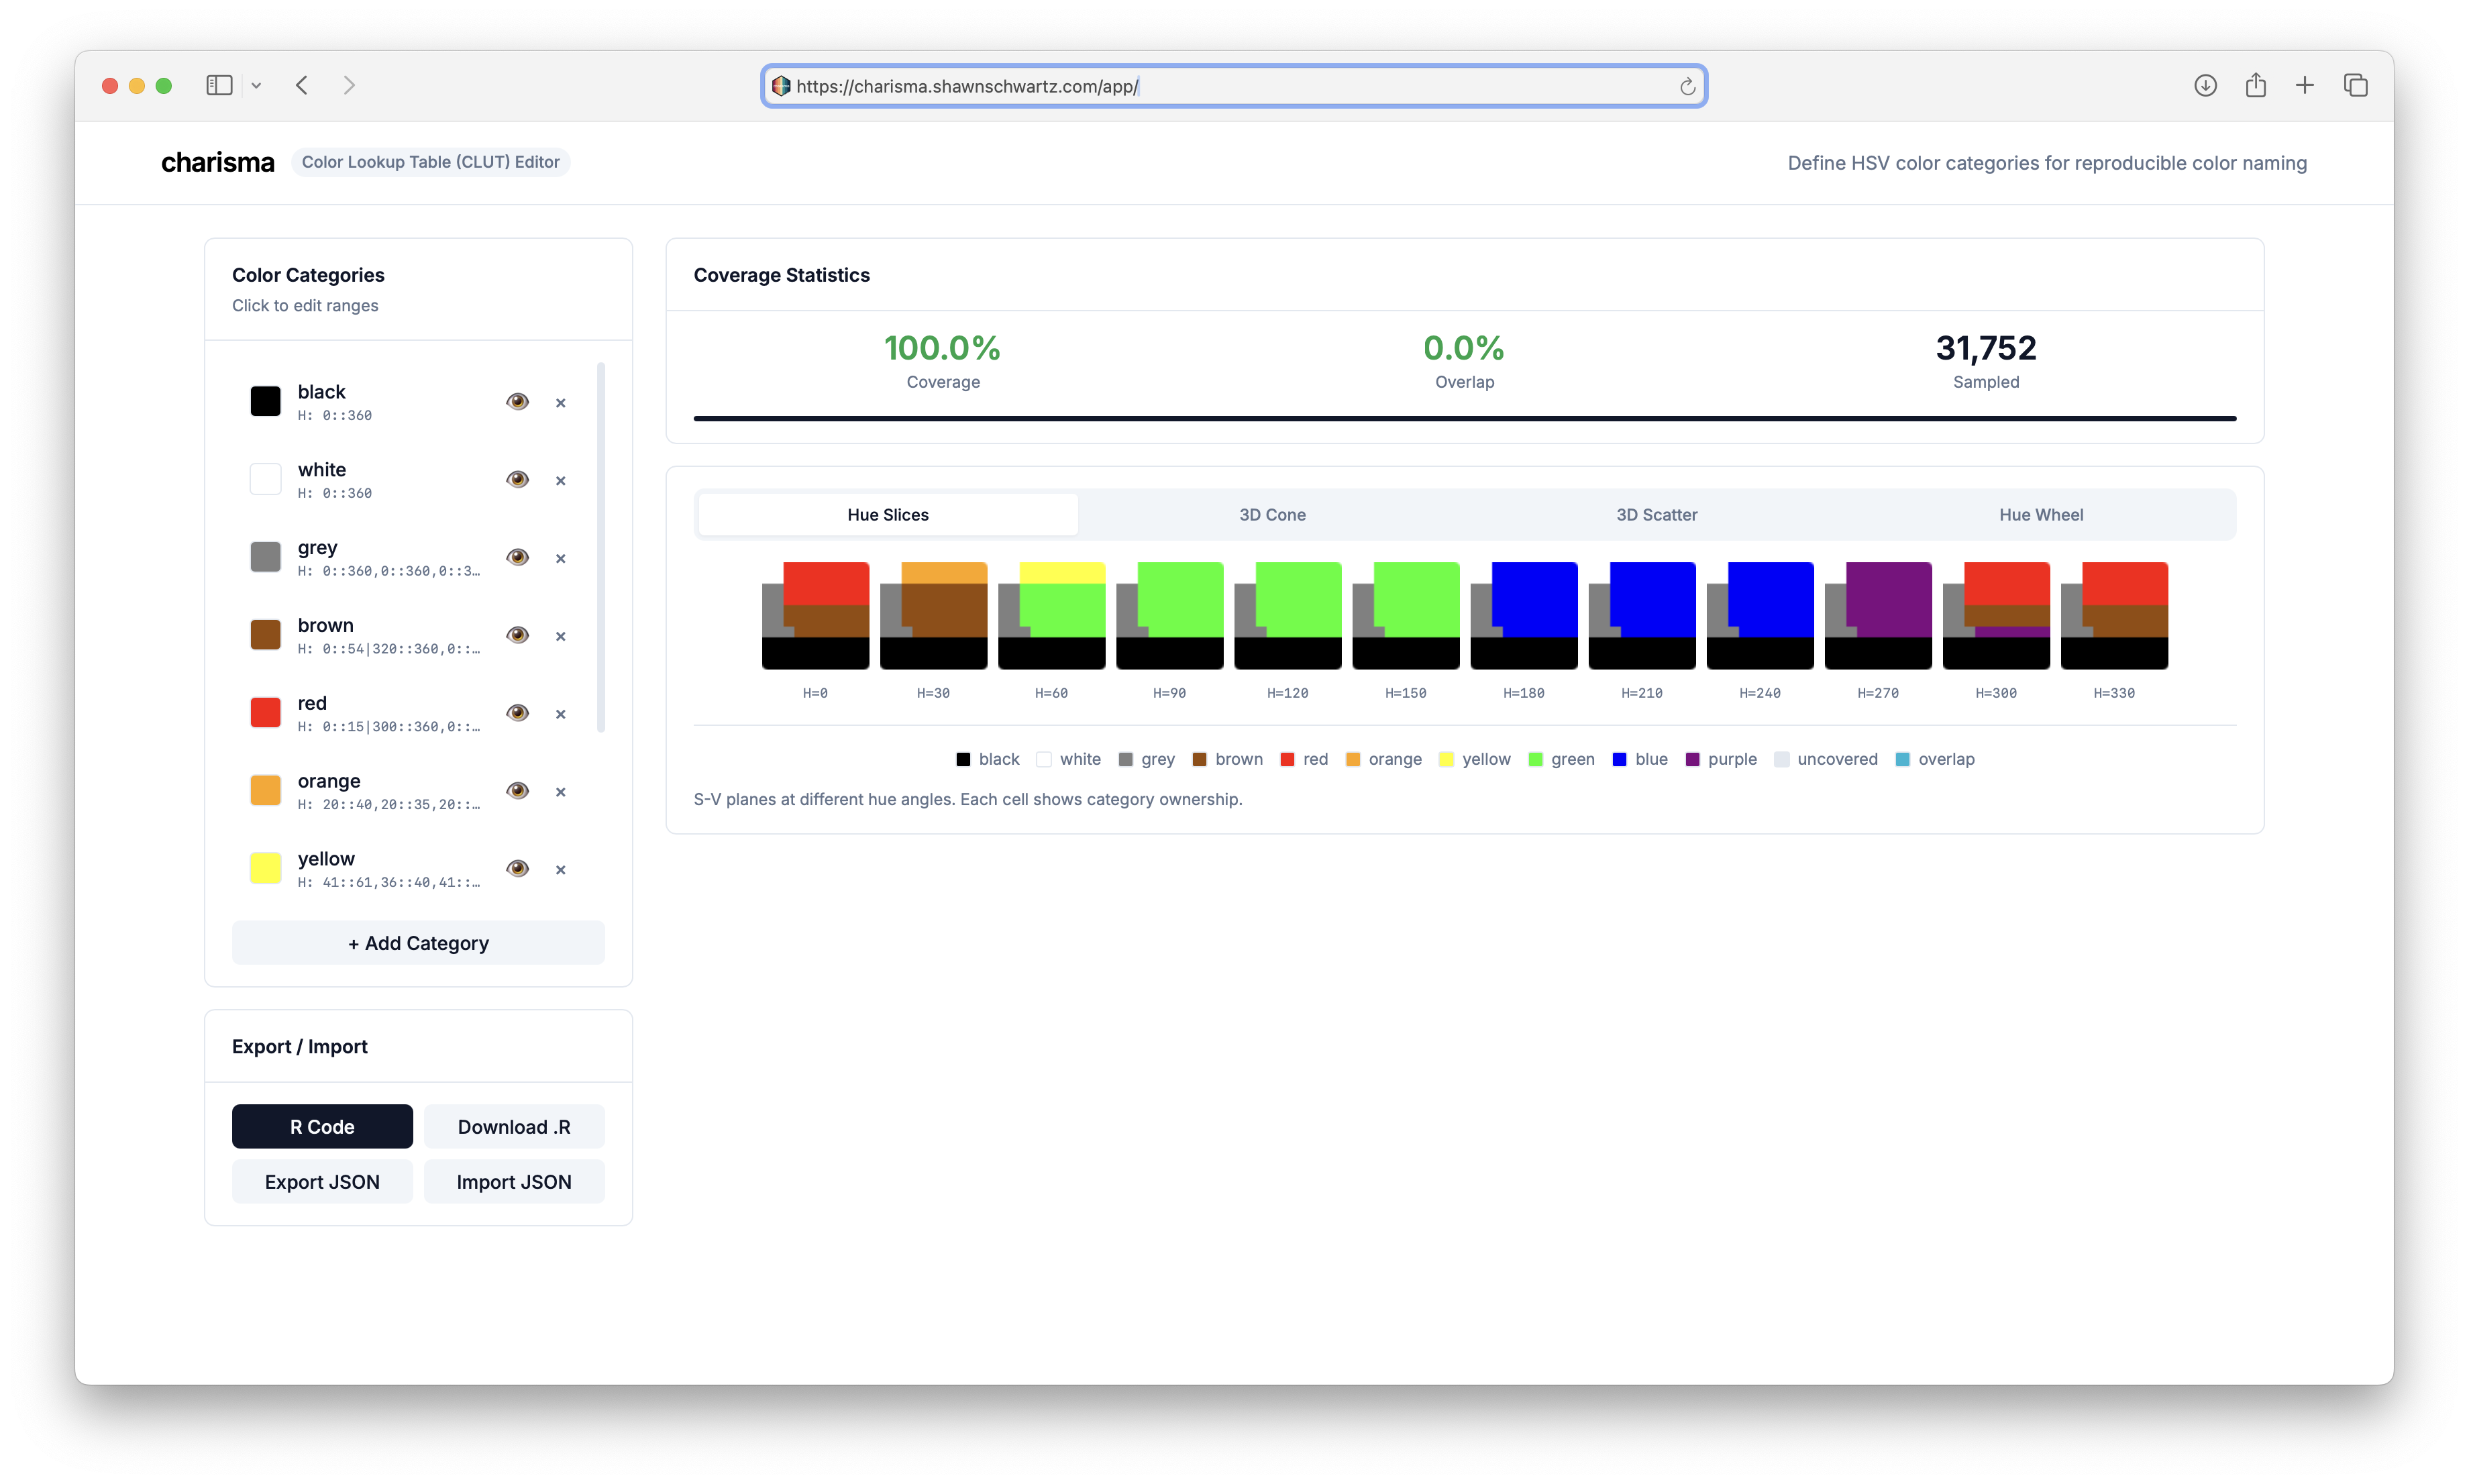
Evolutionary Analyses
# Batch process images
results <- lapply(image_paths, function(img) {
  charisma(img, threshold = 0.05)
})

# Extract color presence/absence
color_matrix <- do.call(rbind, lapply(results, summarize))

# Phylogenetic analyses with geiger
library(geiger)

fit_er <- fitDiscrete(
  phylogeny,
  color_matrix[, "blue"],
  model = "ER"
)

fit_ard <- fitDiscrete(
  phylogeny,
  color_matrix[, "blue"],
  model = "ARD"
)
Citation
If you use charisma in your research, please cite:
Schwartz, S.T., Tsai, W.L.E., Karan, E.A., Juhn, M.S., Shultz, A.J., McCormack, J.E., Smith, T.B., and Alfaro, M.E. (2025). charisma: An R package to perform reproducible color characterization of digital images for biological studies. (In Review).
Acknowledgments
charisma integrates with:
-
recolorize(Weller et al. 2024) - Image preprocessing -
pavo(Maia et al. 2019) - Color pattern geometry